Posts

Showing posts from September, 2013

Electoral divisions along the Berlin Wall

Image
Last week's elections in Germany  ended up more or less as expected. Angela Merkel's conservative CDU has won by a landslide (42%, only 5 seats short of a full Bundestag majority) ensuring her a third consecutive mandate as German Chancellor (an achievement only reached by two previous Chancellors - Konrad Adenauer and Helmut Kohl). Another expected result was the downfall of her main coalition partner, the liberal democrat FDP, which has fallen short of the 5% threshold to enter the Bundestag. This implies some  post-electoral complications  as a grand coalition between CDU and SPD (the social democrats) is inevitable. This was the governing coalition during Mekrel's first term as Chancellor and it was because of the coalition that the social democrats were punished in their subsequent elections. Just like what happened with the FDP in fact. Anyway, with the victory Merkel has further strengthened her position as Europe's undisputed leader, which is undoubtedly good...

Graph of the week: 5 years after the crisis

Image
Last two weeks on the blog, much like in the most of the mainstream media, the focus was on the 5 year "anniversary" of the financial crisis. I opened with a text on Fannie and Freddie's reemergence on the housing market, continued with an overview of some causes and implications of the crisis, and topped it up with the end consequences and cross-country effects .  So today, to finish off the "crisis coverage", I call upon a series of graphs to illustrate some of the main consequences on the financial system.  Source: The Economist The changes are evident in the world of finance. The first two charts show the emergence of Chinese state-backed banks which have managed to break up the dominance of US, UK and European banks, even as the size of top 5 banks' assets has increased (again mainly thanks to the Chinese banks). However, being fully aware of the reasons behind the rapid growth of Chinese banks , they are in for a roller coaster ride simi...

Five years after the crisis: the consequences

Image
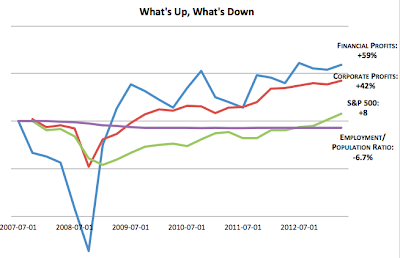
Having portrayed some of the causes and implications of the financial crisis in my previous blog post , in this one I will focus on the consequences and how the countries struck by the crisis are doing today. First off, what has really changed since five years ago? Comparison of US financial and corporate profits, S&P 500 performance and the employment-population ratio. Source: The Atlantic   The quick answer is not much. But the devil is in details. The graph above clearly states that corporate and financial profits have recovered quite significantly, while the E-P ratio remains to be dreadful. An obvious conclusion emerges. The real sector of the economy is entering a new equilibrium and the labour market is yet to adjust. The structural shock has altered the patterns of production and labour market specialization, and it's going to take time for the demand for skills to adjust. The IT shock and the outsourcing trend were among the strongest disruptions on the la...

Five years after the crisis: the legacy

Image
Five years have passed since the collapse of Lehman Brothers and the subsequent devastating blow to the financial system in the US, and the consequential spillover of the panic to the rest of the world. Lehman's bankruptcy in September 2008 was one of those events that could have brought down the entire world financial system. Fortunately or unfortunately (for some) it didn't, but the damage was devastating and the consequences are still present. The recovery has been slow and painful, especially with respect to all other post-war recoveries . Some put the blame entirely on the policymakers, where they either didn't do enough, or did too much (where the unit of value is the size of the stimulus). After the massive fiscal stimuli applied in the US and in many European countries during the downturn, in 2010 after the US crisis was officially over according to NBER , austerity kicked in. Austerity came primarily as a reaction to the doubling or tripling of debt to GDP ratios...

Graph of the week: World GDP

Image
A quick overview into how global GDP is doing. From The Economist : Source: The Economist Graphic Detail  One obvious pattern on this graph is the overall decline of the pace of recovery, despite the growth rate increasing in the second quarter of 2013. Have in mind that the drivers of this higher growth rate were the rich countries, with the emerging markets experiencing a slowdown . The main "culprit" was the relative growth slowdown in China who alone used to contribute one third to global growth, while around 40% was coming from the rest of the emerging markets. Even the somewhat stronger recovery from the West isn't enough to push back global growth to the pre-crisis 4-5%, and substitute for the lost growth. With further emerging market decline being expected, global output is very likely to continue down this declining path, the same path the West is all too familiar with.

Why politicians don't cut spending?

Image
A simple answer to this question comes from Learn Liberty in this short educational video. (If the video doesn't work - some browsers could do that -   you can access it on You Tube .) This here is Public Choice 101. (Btw, if you're interested, they also have an excellent explanation of the  Median voter theorem , the centerpiece model of political economy).  Lessons made in this short introductory video are actually the key principles of public choice theory and its economic analysis of politics. Since the voters are generally ignorant about the policies and the politicians they vote into office, and since they are too dispersed to organize as a group, they are unable to scrutinize their representatives more rigorously. On the other hand various interest groups representing a whole range of industries do have a strong incentive to organize and influence the political process via lobbying as their benefits are less dispersed when acting as a small, pri...

Back from the dead: Here come Fannie and Freddie

Image
In a series of texts on the 5 year "anniversary" of the financial crisis (see among others  the Economist , Financial Times , Wall Street Journal , New York Times ,  Bloomberg ), many commentators and economists are reminiscing on the panic that surrounded the world of finance at the time following the infamous bankruptcy of Lehman Brothers. More importantly they are all drawing lessons for today, evaluating how far we have gone from the crash and how much we have learned. I was planning on making a few of my own contributions to mark the troublesome events from the fourth quarter of 2008, and I will start by looking at where Fannie Mae and Freddie Mac, those two "evil" Congress-led, HUD goal-obliging, government-sponsored enterprises are today. Financial Times has the numbers stating that 5 years after their $189bn government bailout Fannie and Freddie are actually quite profitable.  As the US housing market is recovering from its arguably worst slump in hi...

Graph of the week: how much for a house in Beijing?

Image
Did you know that the prices of housing units in Beijing are higher than those in Manhattan? Could the reason for this be the lack of supply of land (as it is in Manhattan)? Or is it due to speculation that's even further fueling the Chinese housing boom ?  The last scenario might be more suitable to explain the situation. The Chinese are, like the Americans 10 years ago, and the Japanese 30 years ago, "flipping houses", to use the popular term.  And here is the result: Source: Quartz The graph represents growth rates of housing prices in 4 major Chinese cities. Land parcels are being sold for record prices. In Beijing $1100 was paid for a square foot of a residential parcel (compared to Manhattan's average of $323, with the highest bid being $800). Other cities have also experienced a rapid recent growth in real estate prices and land for commercial use. The logical explanation would be that supply is scarce so land prices must go up. This could be true ...

In memoriam: Ronald Coase

Image
Yesterday, at the incredible age of 103, one of the greatest minds of our time, Nobel prize winner and emeritus professor at University of Chicago Law School  Ronald Coase has passed away.  His contributions as well as his influence to the economic science are monumental. His groundbreaking research has set the stage for a joint field of law and economics, and has also influenced the new institutional revolution in addition to a number of other fields and areas of research in economic theory. It would be unfair to say he only made two major contributions since both of these (written 23 years apart from one another) not only won him the Nobel prize, but have continued to influence the economic science ever since. The first was his 1937 paper "The Nature of the Firm"  (downloadable) where he introduced the concept of transaction costs in microeconomic analysis. He believed that firms exists because they economize on transaction costs - costs like market entry, acquir...

India's new central banker

Image
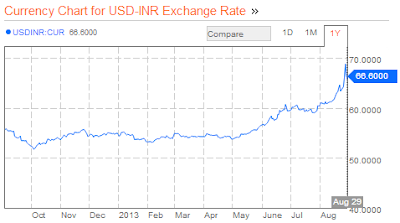
Raghuram Rajan, a notable economist from the University of Chicago and author of the famous "Faulty Lines" book on the financial crisis, is to be appointed as the new governor of the Bank of India . Certainly a role he's more than capable of. He joins a whole line of notable academic economists that ended up in policy - such as Stanley Fisher in the Bank of Izrael, Ben Bernanke in the Fed, Joe Stiglitz in the World Bank, Christina Romer, Larry Summers (also a potential Fed governor), Timothy Geithner, Greg Mankiw and a whole number of others at the Council of Economic Advisers (which isn't really that surprising). Some of these were more successful at their policy roles, some less, but they all proved the importance of having a renowned academic expert (say, a technocrat ) to give advice or directly control some of the nations main economic institutions. I have no doubt that prof. Rajan will be successful in his position. After all, the pressure in India will proba...