The bond market is showing no signs of recession. Yet.
This article was first published on Seeking Alpha on July 15th 2021. This article contains updated graphs for the subsequent month and a half (a new version will look at the situation again in October).
A lot of investors and analysts like to look at various stock market indicators for signs of widespread market hubris, overconfidence, greed (& fear), or an upcoming contraction. Many like to point out that stock valuations are at their extremes, particularly in the tech sector, or that, for example, the Shiller PE ratio is running at a 39 multiple (the only time it was higher was prior to the 2000 dot-com bust).
Many such indicators certainly have merit for uncovering sentiment, and while they can be good indicators of whether a bubble is reaching its climax (e.g. the Shiller PE ratio), whether a market is overheating, or that a correction is due, a much better indicator of an upcoming contraction is the bond market.
This is not only true historically (e.g. via the inverted yield curve), it also makes much more sense. The majority of investors are typically not discouraged from investing due to too high market PE multiples, nor are they timing market entry based on bubble-like indicators. The most important factor for investors has always been the Fed and its interest rate decisions. And the biggest and most important market that depends entirely on the Fed's monetary policy decisions is - the bond market.
Investors, when examining the performance of stocks, typically forget about the bond market as it is far less amusing, more complex and hence more difficult to understand, and much less transparent than the stock market (there is no centralized place to trade and even look up bond prices, particularly for the retail investor). However, disregarding the bond market is a mistake given that it represents the most powerful tool in finance - debt, and by extension interest rates given on this debt. It is full of big players, institutional investors and asset managers of big funds, who are quick to make adjustments based on anticipated and actual interest rate changes; adjustments that almost immediately impact equities, as well as the entire economy. The bond market is much bigger, more liquid and more important than the stock market, especially for early signs of rate changes and hence recessions.
With that in mind let us examine several indicators that can come in handy when figuring out the sentiment of bond markets, all of which can be good determinants of reversal signs and upcoming recessions:
- Inverted yield curve (spread between 10-year and 2-year T-bill)
- Yield spread between corporate bonds and Treasuries
- Yield spread between two-year T-bills and the federal funds rate
- Yield spread between the LIBOR and the federal funds rate
1. The inverted yield curve (spread between 10-year and 2-year T-bill)
Thus far the best predictive indicator of broad market sentiment and turning points for market downturns has been an inversion of the yield curve. When the yield curve inverts, i.e., when the spread between the 10-year and the 2-year T-bill turns negative, this has usually signaled an upcoming recession in 6 to 12 months' time.
 |
| Figure 1: Spread between 10-year and 2-year T-Bills. Source: FRED |
Why does the yield curve invert? Usually, the yield curve is an upwards facing curve (see Figure 2), meaning that investors demand greater interest rates for investing in assets with a longer maturity, which makes sense. You buy a 30-year T-bill and expect to be compensated annually for borrowing your money for such a long period of time (provided that you hold till maturity, which is what most institutional investors do). It's a matter of risk and liquidity premiums; there is greater risk for holding long-term assets. But when the reverse happens, when investors demand greater interest rates on short-term than long-term bonds, they expect short-term interest rates to fall sharply in the future (as a result of a recession, when the Fed cuts interest rates via the federal funds rate).
When investors expect short-term yields to go down, they buy bonds with longer maturities. Greater demand for long-term bonds increases their price and reduces their yield. The short-term rates stay high given the central bank's decisions on the federal funds rate – short term yields usually follow the federal funds rate (see below on the relationship between the funds rate and the 2-year T-bill). So as more and more demand for long-term bonds is materializing, their rates go down and this produces an inverted yield curve.
This is a self-perpetuating and reinforcing mechanism that sends signals to investors on how the market is feeling, and at the same time drives reactions of market actors.
During times of economic growth or a fast recovery, the yield curve is upwards sloping because investors expect the Fed to increase short-term interest rates in the future, so there is lower demand for long-term bonds (or an increase of supply when governments issue many new long-term bonds to finance their deficits, thus reducing their prices and increasing their yields).
 |
| Figure 2. The US T-bill yield curve for July 14th 2021. Source: US Treasury |
When the economy starts to overheat, the Fed usually raises short-term interest rates. But then investors expect that short-term interest rates will have to fall in the future, so they buy long-term bonds which decreases long-term rates (during recessions there is usually greater demand for bonds, as investors move out of stocks). Coupled with the Fed’s increase in short-term rates the yield curve begins to flatten and invert.
Thus far, the yield curve is still a long way from being inverted (see Figure 2). It is slightly flatter from a few months ago, as the 10-, 20-, and 30-year yields have decreased by about 30-40 basis points, while the lower maturity yields have gone up by a few basis points. Not until these trends pick up more rapidly will the yield curve start showing signs of a recession.
2. The spread between corporate bonds and Treasuries (corporate spread)
This is more of a coincident rather than leading indicator (will tell something is wrong when it happens), but it useful to look at for signs of a recovery.
 |
| Figure 3. Corporate spread; spread between Baa corporate bonds and the 10-year T-Bills. Source: FRED |
In times of economic optimism, corporate spreads are tight (and reflect current low interest rate environments). In times of economic weakness, corporate bond investors expect cash flow issues which might increase corporate defaults. Hence, they demand higher interest rates for riskier corporate bonds instead of low-risk Treasuries. The indicator is a good measure of risk aversion of investors. The wider the spread, the greater the risk aversion.
Currently, corporate spreads are tight, a typical sign of a low interest rate environment. No surprises there.
3. Yield spread between two-year T-bills and the federal funds rate
The 2-year T-bill is, according to many, considered to be a better indicator of turning points in markets than the 10-year T-bill. The reason is its close correlation with the federal funds rate, because the yields on short-term maturities are largely determined by the cost of money. The same is true for other short-term bonds, like the 1-year, the 6-month, or the 3-month T-bill.
 |
| Figure 4. 2-year T-Bill minus the Federal funds rate, for the past five years |
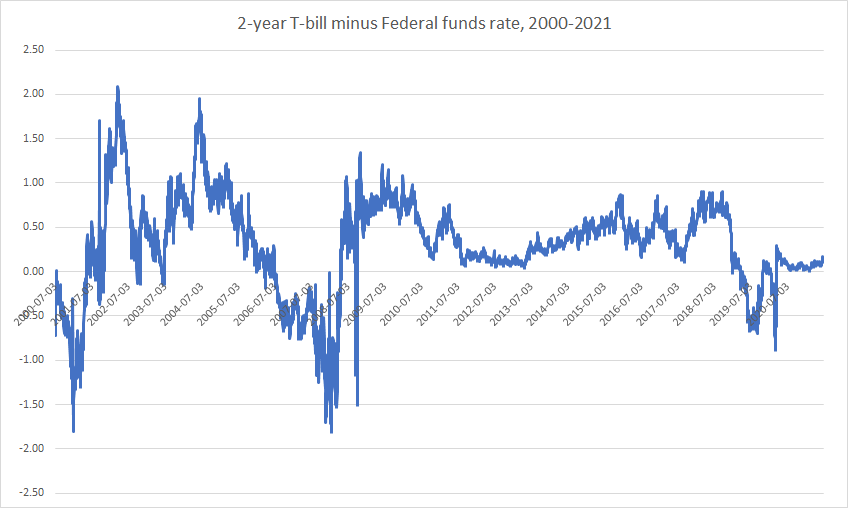 |
| Figure 5. 2-year T-Bill minus the Federal funds rate, for the past twenty years, signalling a recession in 2001, 2008, and 2020. Source: DGS2 and EFFR |
The logic here is similar to that of the inverted yield curve. If the cost of money (the federal funds rate) is higher than the yield on the 2-year T-bill, investors buying the T-bill incur a negative carry, because the yield they are earning on the T-bill is lower than their borrowing costs.
Whenever the 2-year yield dips below the federal funds rate, this was followed by the Fed lowering the federal funds rate a few months afterwards. Investors tolerated negative carry for only a short period of time, before the Fed reacted.
This is therefore a leading indicator, with an even quicker reaction time than the yield curve inversion. When the 2-year yield dips below the funds rate, the Fed will very soon start lowering rates, so be prepared.
In other words, when the spread turns negative, this too is a sign of an upcoming recession. Right now it is not showing signs of turning negative. Both the 2-year and the funds are are low, and will continue to stay low until at least the end of next year.
To stay informed, it is also helpful to track expectations about the Federal funds rate: CME FedWatch Tool: Countdown to FOMC - CME Group. Expectations are already forming for mid-2022 about the increases in the funds rate, so keep track of that next year.
4. Yield spread between the LIBOR and the federal funds rate
The 3-month LIBOR is the interbank interest rate, the rate at which banks lend to each other. When the LIBOR spikes, it indicates fear among banks – they are afraid to lend to each other and their reference interest rate goes up. A good example of this was the 2008 financial crisis, in particular the September to November period, where fear and panic were at their absolute highs, while lending was frozen. This was the highest spike in the spread ever witnessed, going up to 400 basis points. Even the COVID spike was not nearly as high, but it did send a signal of temporary fear among the banks, which was soon alleviated.
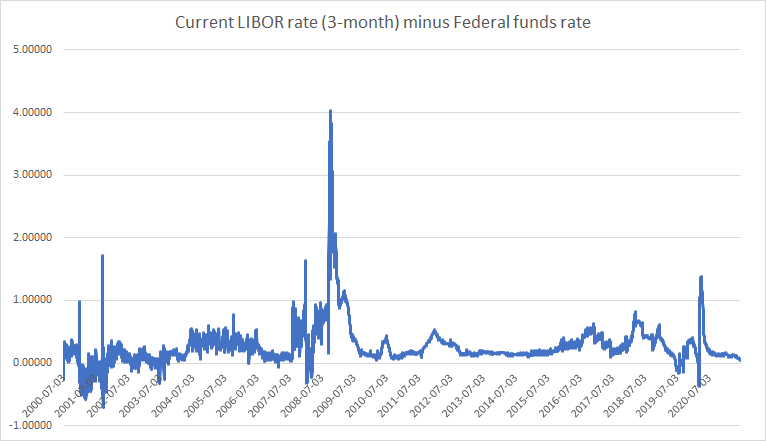 |
| Figure 6. LIBOR rate (3-month) minus the Federal funds rate |
The reason this spread is important is that it tells us to which extent banks are concerned with counterparty risk and liquidity (and by extension systemic risk of the banking industry). It is thus a coincident indicator of recessions (it jumps when the recession already happens), but the higher it is, the stronger the crisis impact on banks, which typically indicates a prolonged recovery (such as the 2008-09 aftermath). Also interesting, it tends to go negative just before episodes of crisis, due to the same reasons as described above. Currently it is signalling a stable situation in the banking sector, meaning that there should be no lasting impact on the speed of the recovery.
Other useful bond market indicators
I recommend reading The Strategic Bond Investor from PIMCO's Anthony Crescenzi (a new 2021 version of the book is out, covering the COVID crash in March 2020). In addition to the aforementioned yield spreads, he points out a few other interesting indicators of tracking bond market sentiment centered around understanding the behavior of speculators vs institutional investors (i.e. "dumb money" vs "smart money").
- For example, it is useful to keep track of aggregate duration surveys, which measure to which extent portfolio managers are exposed to risk (higher exposure to risk means you raise duration by increasing the average maturity of your bond portfolio, as longer-term bond prices are more sensitive to interest rate movements). These increases/decreases of duration are typically measured against the benchmark, the Bloomberg Barclays Index. The higher the duration over the benchmark, the more chance of a reversal. However, in the aftermath of the current crisis, it is doubtful whether portfolio managers will increase their duration too high over the benchmark because they expect short term interest rates to rise over the next two years and this could hurt their longer duration exposure.
- A second useful indicator is to track the Commodity Futures Trading Commission’s Commitments of Traders report. The COT report categorizes holders of positions in US Treasury futures contracts. It shows whether the futures activity is driven by speculation or standard commercial activity (like currency hedging). The standard hedging activity is driven by the end users of contracts, the so-called "smart money" institutions like primary dealers, insurance companies, pension funds, etc. On the other side are speculators seeking to make short-term profits. A market top or bottom can be anticipated by extreme positions from speculative traders in the futures market. They suffer from heard mentality and accumulate too much of such assets in the end of a market trend (extrapolating short-term trends and recent experiences, hubris-driven investing, overly optimistic, overconfident, etc.). Currently, the speculative traders in the futures market are not holding such extreme positions.
- Finally, as with equities, Treasury futures too have a put-call ratio, measuring the ratio between the daily trading volume in put versus call contracts. Extremes will also signal potential pull-backs in the market, particularly if there are other outside risks involved in the bond market (like political risks; think back to the Greek sovereign debt crisis in Europe). This indicator is best viewed by comparing the 10-day average with the 1-year average. When the 10-day average is sharply above the 1-year, this is extreme fear and a pull-back is imminent. Investors are then buying more futures puts than calls, expecting a decline in bond prices. The extremes are typically between 0.8 on the short end and 1.8 on the long end. Currently the rates are around 1.2-1.4, and are not riding very high compared to the 1-year average.
Conclusion and implications
None of the indicators shown above suggest a reversal of trends or an upcoming recession anytime soon. This is because investors still look to the Fed and their interest rate decisions. This is also why inflation has become such a hot topic. Because of higher inflation expectations investors expect the Fed to start lowering its rates earlier than 2023, what was initially communicated. And with earlier than expected rate increases we can assume the bond market to signal these changes sometime in 2022. Currently it hasn't budged, despite the numerous overheating indicators in the stock market. But as both history and common sense tell us, the bond market will give us a much better idea of when the reversal will happen.
Therefore, keep a close eye on bonds rather than equities for a sign of a recession, and don't pay much attention to predictions of imminent crashes on YouTube, especially the ones predicting hyperinflation. The equities can still face a correction hear and there (similar to the S&P500 and the DOW corrections in August and October 2020, or January, February, and June 2021), but thus far, it is safe to keep being long in equities.


Comments
Post a Comment