Understanding unemployment
Today's reports on the decrease of US unemployment to 8.5% and an increase in nonfarm payrolls by 200,000 in December 2011, resulted in an expected increase of optimism among economists and investors. Every job creation is most welcomed, particularly since increasing job creation is a sign of a positive direction of the economy. It is expected as the recovery paces up, uncertainty will decrease and confidence will increase, making the firms invest more and eventually hire more. More jobs being created will further stimulate the positive feedback loop as more people will have stable incomes, anticipate a more certain future stream of income and will spend more thereby increasing the aggregate demand. So if we see positive signs of job creation one could conclude that we are half way there to achieving a complete recovery? Not quite.
I don't mean to be too pessimistic, but I would like to draw attention to the article by Dan Mitchell of the Cato Institute:
If the unemployment rate drops because hundreds of thousands of jobs are being created each month, that’s obviously good news.But if the jobless rate falls because the government estimates that lots of people have become discouraged and dropped out of the labor force, then that’s not good news.In other words, sometimes the unemployment rate, by itself, doesn’t tell the full story.That’s why one of the best statistics to look at is the employment-population ratio, which measures the number of people who have jobs and compares it to the number of people who could have jobs.
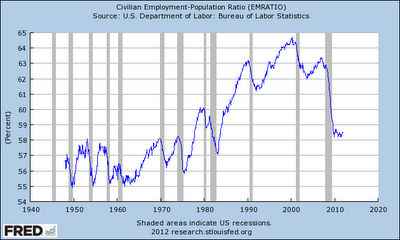
I have checked the FRED for the data on this unique and interesting indicator, the employment-population ratio, and have found that unlike the unemployment rate, it still isn't showing any positive signs of recovery.
 |
| Source: St. Louis Fed, FRED Database |
 |
| Source: St. Louis Fed, FRED Database |
As can be inferred from the graph, unemployment is still at low levels and the employment-population ratio is locked down to the levels of 30 years ago. One conclusion of why this could be so is the fact that many people simply dropped out of the labour force. They became discouraged workers and have ceased looking for work. This movement would artificially lower the unemployment rate (calculated as the ratio of unemployed over the total labour force) as people who drop out are simply not accounted for.
The employment-population ratio does capture this change as the people who are out of the work force are still accounted for in total population. It tells us that the recession is far from over. Uncertainty is still too high, confidence too low, businesses still constrained with regulations, high costs and a lack of funding, banks still unwilling to lend to take risks, and unemployment is still to high. Once the preconditions have been made, job growth will follow and the scenario from the beginning of the text will be achievable.


Thank you for this analysis.
ReplyDeleteDo you know how the government measures/estimates the civilian employment-population ratio?
The ratio compares the total number of employed over the total population including only individuals within the working age. Both parameters are easily measured and published by the Bureau of Labor Statistics.
ReplyDeleteIf you're interested in the detailed methodology, check the web page of the BLS:
http://www.bls.gov/lau/rdscnp16.htm
Anonymous: The Census Bureau and BLS survey 60,000 households every month as part of the Current Population Survey, asking a bunch of nosy questions including whether folks are employed etc. But the Current Population Survey also asks people who aren't working, why, and whether they current want a job. Most people who aren't working DON'T want a job -- in 2010, of the 83.9 million Americans over the age of 16 who said weren't working, only 6 million said they wanted a job. The rest were retired, disabled, raising kids, in school, etc.
ReplyDeleteObviously the shaded areas in the graphs were caused by increased unemployment during recessions, but more long-term there's plenty of other things that would effect the employment-to-population ratio: people retiring earlier; retired people living longer; parents becoming more likely to drop out of the workforce to raise children; teenagers becoming more likely to go to college; more people claiming Social Security disability payments, etc.
@derek
ReplyDeletethank you for the methodology clarification. A lot of people in the category of 'not in the labour force' and 'don't want a job' are in the 55 years and older category (around half), or are disabled and so on. These categories of people are not included in the total workforce (especially the retired) as measured by the population parameter in the employment-population ratio. But those who want a job and those who became discouraged increased from 2009 to 2010 (as is shown in the table you provided). This is what drove the EP ratio down, and is keeping it down.
Let's discuss the long term effects. Do you think that the lower levels of the ratio (a lot of people leaving the workforce) coincided with the unemployment increase during the crisis? Even if it did, we cannot make that assumption now. There simply isn't much information to conclude of a positive or negative trend. The parameter itself (EP ratio) is inconclusive on the trend, but is very suggestive of the situation within the labour force - it's not good as there is no positive change at the moment. If you look at the movement of the ratio at the beginning of 2010 and the beginning of 2011, would you conclude that this is a positive trend? No. That is exactly why you cannot make the same assumption now.
Isn’t the employment-population ratio also biased against the fact that many people able to work are students for example, or does it exclude students altoghether?
ReplyDeleteTrue, this is a negative side, because of students it tends to be a bit lower than it actually is.
ReplyDeleteHowever, when looking at the relative change of the parameter, I don’t believe the students drive the bias that much. Besides, on the graph, there were students in the 90-ies and the 80-ies, so this is something that is constant across the observation and not really significant in explaining the current situation – it’s not like the US universities are experiencing an upsurge of students all of a sudden.
Ok, true, but I read (see here, here and here) that there is actually an increase in the student population over the last couple of years. People (especially young) simply choose to go back to college and not risk being unemployed for too long. They choose to brush up their CV a bit, I guess
ReplyDeleteAgain, this tells you that there’s something wrong with the economy, right? Otherwise they wouldn’t have to choose more college over work. And the ratio captures that yet again – more students driven by necessity out of employment are increasing the non-working population (the denominator) and hence driving down the ratio.
ReplyDeleteSo it's a little over a month later and the fundamentals just keep improving. Employers are reporting increased hiring. That is decidedly NOT people giving up on looking for jobs. It is actual jobs being created. Sorry conservatives, you're just going to have to deal with the heartache of things improving in our country even though you don't like the president. Awww... poor you.
ReplyDeleteThe 'fundamentals' of which you speak still aren't all that improving. Rather they are, as I pointed out in the text, still stagnating.
DeleteHere is the latest data on the employment-population ratio from the BLS, and to support this here is the civilian labour force participation rate. While the E-P ratio is stagnating, people are dropping outside the labour force (observe the data in the tables below the graphs), implying more discouraged workers. I would love to see the economic situation in the US improving, but currently, more factors than employment need to be taken into perspective to make that conclusion. It's best to wait until the end of the first quarter to make stronger inferences on the state of the recovery.
As for the unemployment rate, the post itself best explains why it tends to be a weaker concept than the E-P ratio to determine the health of the economy.
Furthermore, this blog carries no bias, liberal or conservative. It's idea is to provide and analyze facts, from a purely logical perspective. If logical conclusions contradict ones opinion they shouldn't be automatically discarded.